In part two, we looked at stock market inefficiencies and how the Shiller PE allows us to spot them. Now that we know there’s inefficiency, the question becomes how to grab some of that cash for ourselves. In other words, we need to figure out how to be a contrarian and profit from the hordes of people consistently mis-pricing the S&P.
The only problem here is that actually taking a contrary position, in the right way, at the right time, is not easy. Everyone thinks they’re a contrarian, but by definition only a few people actually are. It’s not immediately obvious how best to go about it, so I’m going to suggest some options, look at their pros and cons, and then finally settle on one of the components of our speculative portfolio.
To refresh your memory, here’s the Shiller PE chart from last time:
Now let’s look at some ways to trade this….
Option 1: Buy low Shiller PEs, sell high Shiller PEs
Ahh yes, the good ol’ buy low, sell high. What advice could be easier? Well, actually pretty much any advice. The first problem is that opportunities to buy low are rare things. Looking at the chart, any Shiller PE less than 10 might be attractive. So when did that last happen? 1985. Crap – 27 years ago. Even at the S&P’s lowest during the last crash we didn’t quite get to a Shiller PE of 10. Now, maybe it’s just me but a 27 year lockout period where you can’t enter the market is ugly. In practice it means you’re rarely going to be able to enter a position or add capital to an existing one. That in turn means your capital will mostly be idle, which violates one of the initial goals of of speculative investment replacement strategy: high capital utilization.
Incidentally, this 27 year period of high Shiller PEs is what I’m talking about when I say that investing right now is a bad idea. Yes, when the boomers sell all their stocks PEs will probably drop back down to the point it makes sense to invest. But it’s going to take a while for them all to die, and I’d like to do something worthwhile with my money in the mean time.
It should also be noted that shorting the market directly on the basis of high Shiller PEs is not a feasible strategy. As Shiller PEs go up, market returns hover around zero, rather than going notably negative. Shorting something with a zero return makes you zero money. Nix that idea, which is really too bad. Because if shorting high Shiller PEs worked, we’d have no shortage of opportunities right now.
Option 2: Re-balancing and/or cost averaging
Boring-ass money managers, this is your chance to shine! OK, maybe that’s a bit much. But since buying low is so remarkably difficult and timing sensitive, many investment advisers suggest buying S&P (or similar instruments) at a constant rate, The idea is that, yes, you’ll buy high some times but if you stick to your buy schedule you’ll also buy low sometimes.
Now, to be clear, there is some advantage to this sort of cost averaging. Buying in this manner tends to return very slightly higher than average market returns – the reason being you buy more shares (if not more dollars) when the market is down and fewer when it’s up. But we’re not talking some big edge here – maybe a 1% advantage over what market returns would otherwise be. And since Shiller PEs are in the 20s right now (and thus expected 20 year returns are <5%) tacking another 1% on that still doesn’t get us very close to our target: 15% a year or so. This isn’t a BAD idea per se, but it’s clearly not a good enough idea to pursue vigorously.
Option 3: Long term trend following
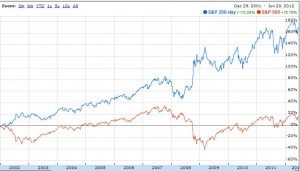
If you’ve been super-diligent about reading this blog from the beginning, you may already know where I’m going with this. A good starting point is to read up on trend following. Now, the sad fact of that article is that Donchien-style trend following no longer works. But there is another kind of trend following on the S&P that has continued to work. It’s probably an example of a naive market situation. To refresh everyone’s memory, here are the S&P trend following rules I laid out:
- plot the S&P 500 with weekly bars against a 40 bar (40 week/200day) exponential moving average.
- whenever the S&P closes 13 consecutive weeks (1 quarter) above the average, go long.
- whenever the S&P closes 13 consecutive weeks below the average, go short
The Actual Portfolio
OK, so we’ve got a kickass speculative trading method on the S&P that captures herd movement. So what do we actually put in our portfolio?
Well, first we need to choose an instrument. If you want to trade S&P in stock form, there’s only one choice: the SPY index fund. It’s heavily traded, readily available for shorting, and general all around high-liquidity goodness. If you have a multi-million dollar account you might want to look at using the CME S&P futures instead, but that’s beyond the scope of this article.
So we’ve got our instrument and we’ve got our strategy. Now how big a position should we take? Well, if you go back to our goals, the max exposure we were willing to have to the broader market was +-20%. This strategy is certainly a good way to “spend” that 20% exposure, so our position for the S&P trend following strategy will be 20% of the size of our account either long or short as the strategy dictates.
In part 4, we’ll start looking at what to do with the rest of our speculative account. Thus far I’ve only used 1/5th of the capital (and with margin I might use more than 5 5ths) so we’re going to need to find lots more ideas.
Continued in part 4.


Loving that ass-kicking graph you have in the centre here – returns of 170% are indeed spectacular. The way you’ve laid it out seems like a magical solution – but nothing is that easy, right? Either way I’m hurrying off to try out my own spreadsheet experiments!
I don’t think it’s necessarily easy or magical. The drawdowns can be pretty big. Historically they’re not as big as the drawdowns in the S&P itself, but they’re nothing to laugh at. Personally I wouldn’t want more than 15% of my net worth exposed to this strategy, but it’s good enough to allocate some money to.
Let me know what your investigations turn up.
One small addition to this fine article.
You wrote:
plot the S&P 500 with weekly bars against a 40 bar (40 week/200day) exponential moving average.
whenever the S&P closes 13 consecutive weeks (1 quarter) above the average, go long.
whenever the S&P closes 13 consecutive weeks below the average, go short
The directions were a little unclear to this neophyte, until I read the original entry that you linked to which included the following passage:
“Maintain your bias until it closes 13 week the opposite direction, then switch.”
It clicked after that.
I’ll try to find a way to clean that up. I didn’t really like how it read when I wrote it, and if you were confused I’m sure many other people are as well.