This is a continuation of Part 1 – start there if you haven’t read it.
Last time we worked out how one might go about speculating in Tickle Me Elmos in 1996, and I made the claim that the same logic can be used to trade the S&P in shortage situations today. If you’ll recall, the basic plan was as follows:
- Identify a good to speculate in based on sufficient TAM and a shortage of the good, which manifests as increasing price and gross margin.
- Determine a “will-buy” price for that good which takes into account the shortage, leaves you sufficient margin, and leaves a reasonable chance someone will sell to you. Make it be known you will buy the good at that price.
- Wait for someone to take you up on your offer. If someone does…
- Sell the good at full post-shortage prices on the open market.
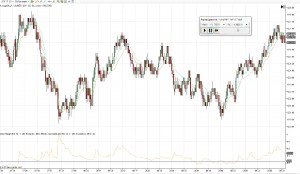
In order to implement step 1, we selected ES as our instrument based on TAM, and developed an indicator to calculate gross margin, producing this chart:
 Now I want to dig into the details of the indicator and chart a bit more. The first thing of interest is the values of gross margin. It’s interesting that they’re never, ever negative. What that means is that if you look at the last 15,000 contracts bought and 15,000 sold, the liquidity consuming traders never made money on average. The customers are always losing. From a business perspective this makes sense – liquidity consuming traders are paying for the privilege of having total control over their position What this means is that it doesn’t make much sense to speculate using liquidity consuming (aka market) orders – they cause you to pay an additional tax which is very difficult to overcome. Non-marketable limit orders are the speculator’s key tool for entering (and usually exiting) positions.
On the gross margin plot I added a horizontal line at 0.25. The ES contract has a tick of 0.25 S&P points, so that line represents gross margin of exactly one tick. What does it mean when gross margin is above vs. below the line? First of, you need to know that the bid-offer gap in ES is always one tick during regular trading hours unless something very strange (like the flash crash) is going on. Nothing like that appears in this chart, so we can safely assume the bid-offer gap was 0.25 the entire time. Now, if the gap is 0.25 you might reasonably wonder how the gross margin could ever be anything other than 0.25. But clearly it’s not (usually it’s higher). The answer lies in how we’re averaging the buying price and selling price – it’s an exponential average with the decay constant set to 15,000 contracts in this case (it’s configurable). So if the gap between the average buy and average sell is greater than the bid-offer gap, that means the liquidity consuming traders are more eager to buy when the price is high and more eager to sell when the price is low. That’s synonymous with losing money, of course, and it’s good to see that the gross margin is almost always larger than 1 tick since we intend to win some of that money they’re losing. In fact, for the purposes of this method we’ll just flat out refuse to trade when gross margin is less than 1 tick.
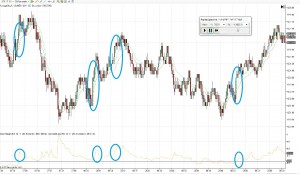
Also note that in certain periods of fast price movement, the opposite line on the top chart falls behind (ie. the sell price line falls behind during a shortage). That makes sense – a shortage is the absence of sellers, so the exponential averaging of the sell price line shouldn’t update that much and it should lag. That gives us a visual tool to spot shortages. Now I want to go and mark the shortage situations on the chart:
You can see each one has rising price separated from the average sell price and increasing gross margin. I did have to make a bit of a judgment call as to how big an increase in gross margin was required – I could have tagged 8:26 as a shortage as well but didn’t because the increase in gross margin was so anemic.
At this point step 1 is complete – I have a method for identifying shortages in ES.
Now, step 2 is to pick a buying price. For simplicity’s sake I’ll use the average sell line (red) rounded to the nearest tick. My logic is that if I get an entry price about as good as all the other liquidity-supplying speculators, that’s good enough. One wrinkle is that if price makes another major upwards move without filling my limit buy, I’m going to simply abandon the speculation. The market has gotten away from me and there’s too much of a risk of buying high if I chase it.
Step 3 basically takes care of itself. Either it happens or it doesn’t.
Step 4 is to sell to the raving Elmo hordes. In this case, I’m going to do that by simply entering a limit order to sell 6 ticks above the entry price. I won’t enter this order until my entry order is filled however – I don’t want to end up short and have price move against me. I’ll also enter a stop 6 ticks below my entry price to provide risk control if the shortage ends and I’m losing money. These two order will be a “one cancels all” group so that if either executes, the other is canceled. Now, you might reasonably ask “Why 6 ticks?”. The answer is that I know that’s a reasonable stop and target size to catch small moves in the ES so I’ve already got it programed into NinjaTrader. If you were working this system up for real, you’d probably want to experiment.
That said, let’s fire up the simulator and see how our new trading strategy works on that day:
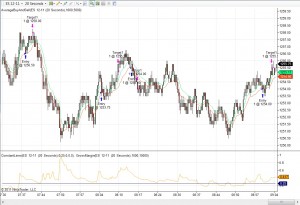
You can see how I entered a trade when price touched the “average sell” line after each shortage developed. From there the automatic stop and target logic took care of the rest.
The trades associated with shortages 1,2 and 4 were winners. The trade associated with shortage 3 was a loser. Assuming I was trading 1 contract of ES, I would win $225 from the winners, lose $75 from the loser, and pay $16.04 in commissions for a net result of +$133.96. Not too bad.
Now, I certainly don’t want you to believe that this system works just on the basis of me going 3-1 trading it in a backtest which for all you know I could have rigged. That’s not even close to sufficient evidence. I actually backtested this through 2 weeks of historical data (with some tweaks I’ll save for another post) and got about 65% winners over about 40 trades, which thanks to the power of small edges is more than enough to make money. But even that shouldn’t be enough to convince you and in a future post I’m going to have to explain how you do go about collecting enough evidence to really believe that a method works. My point for now is just to show how “conventional” business logic can be translated into trading systems, and get you thinking in those terms.


“I actually backtested this through 2 weeks of historical data (with some tweaks I’ll save for another post) and got about 65% winners over about 40 trades, which thanks to the power of small edges is more than enough to make money. But even that shouldn’t be enough to convince you and in a future post I’m going to have to explain how you do go about collecting enough evidence to really believe that a method works. ”
Really looking forward to these future posts.. Thanks a lot man.
Great post! I’ve never actually traded securities before but I want to learn how to do it and hopefully start earning income that way. Do you know any sites that offer training material on forex and equities trading? etc
I went to your home page and I found an article you wrote for people who are new to trading so scratch the first comment! In fact after going to your homepage I realised your blog is really about things that I want to learn. I’m going to be following this blog for a loooooong time. Keep up the good work!