Here’s a tidbit to think about: broad market reactions are not symmetrical. The market doesn’t move down the same way it moves up. Downward moves are generally much larger, faster, and shorter in duration. Upwards moves are slower and more sustained.This is true on any time frame at least a day long.
For example, you can see here that there have been 19 days in the history of the S&P 500 (created in 1957) where it has dropped 5% or more from the previous day’s close. The biggest was -20.5% in one day in October of 1987 – by far the most dramatic post-WWII market event. In contrast, there have been only 13 days where the S&P 500 has increased by 5% or more, and the largest was 10.8%, a retracement in the broader market fall during late 2008 triggered by an expectation of Fed rate cuts. In other words, big downward moves are both more common and bigger than big upward moves.
You’ll see similar patterns in other risk-on markets world wide. Risk-off markets like US the T-bond market tend to have the opposite pattern.
Why is this? Well, there’s two reasons:
- The world is net long
- Fear is a stronger and faster emotion than greed
What I mean by this is that, overall, the world owns risk-on assets like stocks and commodities. So when prices start to fall, there are more longs who are fearful than there are shorts who are greedy. And as I said fear is a much stronger emotion than greed. It has more ability to get people to act. But perhaps more importantly, fear is FAST. It’s associated, back in evolution, with running away. That’s not the sort of thing you do in a measured, methodical way. You just run. People who spent a lot of time thinking about the merits of running and comparing possible courses of action got eaten by lions.
Greed, on the other hand, is a slow thing. If you go back in time it’s associated with the hunt – a methodical process of acquiring what you want. These days that’s money. Back then it was delicious antelope. But the principle is the same – greed allows time for thinking, even plotting and scheming.
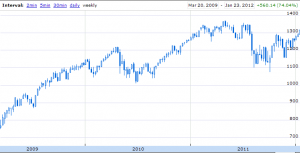
The result of all this is that markets move in a common pattern on long time frames – long, slow ascents followed by rapid declines like this chart of the last 3 years of S&P 500:

Great points – and true! Not related fundamentally, but similar in observation… don’t you love how gas prices at the pump tend to spike on any rise in crude and/or global fears over oil supply, but they tend to decrease MUCH more slowly?
That’s a very interesting observation, and true I believe although I haven’t actually checked it. What makes it interesting is that crude (and RBOB gasoline) behave like risk-on assets in general. But when there’s a supply crisis, they flip to being risk-off, and rise fast on fear and fall slow on lack of fear.
Gold shows an analogous flipflop behavior, although the causes are sometimes different.
Hah! Good imagery, there were just no slow animals drinking at the water hole. There be lions.
I haven’t heard the “risk-on” and “risk-off” terms before. Could you elaborate and explain how treasury bonds are opposite?