 If you pay attention to the financial press, you’ve probably heard the markets described as “volatile” at one point or another. In this context, volatility is not merely descriptive. It has a specific mathematical meaning which can help you make better trading (or for that matter, investing) decisions. In order to succeed as a trader you need to have a strong working understanding of volatility and its implications.
When discussing volatility, it’s important to make a distinction between historic or realized volatility and implied volatility. Historic volatility is a measurement of how much a given market has moved in the past. Implied volatility is a prediction of how much prices might move in the future. This prediction is derived, or implied, from the price of options contracts on the underlying security.
Volatility is measured in strange units: standard deviation of percent change in price over one year. Yeah, that’s a mouthful, but let’s break it down. Over a year, the price of of whatever we’re talking about is going to change. Let’s say we’re looking at the volatility of the S&P500 index in 2010. On open on January 4, 2010 the S&P 500 index had a value of 1117. It closed on December 31, 2010 at 1258 – a rise of 12.6%. That’s an example of realized volatility. But it doesn’t tell us much – it’s just one data point. We could also look at 2011, when the S&P 500 changed not one whit over the course of a year – 0%. Clearly volatility changes over time. Now we can see where the “standard deviation” part comes it – standard deviation is simply a measure of the width or spread of a group of numbers. So if you take all the 1-year measurements, and take their standard deviation, you get the volatility of the S&P index in the conventional units.
There’s only one problem with this – you don’t have enough years. Generally for statistical computations like this you want to have at least 30 data points. That’s not a hard and fast rule, just a good guesstimate. But if you went back 30 years to compute volatility, you’d be using numbers from markets radically different than today. Markets that preceded electronic trading, the 401K (and hence Joe Sixpack’s entrance into the markets) etc. Things were different back then – any volatility number computed that way would be rather absurd. The solution is to get more data points by taking them over a shorter period of time, and then scaling up. The scaling factor is the square root of the faction of a year measured. So if you measured changes over a 1-month period (say, 36 measurements over 3 years) you would then take the standard deviation of the percent changes and multiply by sqrt(12) to go from months to years. A similar scaling by sqrt(252) could be used to go from day-long samples to years (there are 252 trading days in a normal year). There’s a more in-depth discussion of this scaling procedure and the mathematics around volatility on wikipedia.
Incidentally, if you find the whole standard deviation business confusing, you’re not alone. The pros are confused too. It sucks, but that’s life. Cope.
OK, now we know how to get a number for historical volatility. That tells us what has already happened, which is about as useless as this thing. What we really want is some sort of understanding about the future – something with predictive power. One possibility is to simply use historic volatility computed over a short time frame (say, 30 1-day samples) as a proxy for expected future volatility. It turns out that’s not a bad approach. If the markets have been volatile they tend to stay volatile and vice versa. But it does miss situations where we know some major event is going to happen in the future that will radically change prices.
Enter an alternative: implied volatility. One of the terms in the pricing formulas for option contracts is an expectation of future volatility. For the uninitiated, an options contract gives the purchaser the option (but not the obligation) to buy or sell something at a fixed price in the future. As you might imagine, that option becomes more valuable the more volatile the market is. All the variables except volatility in options pricing are measurable facts, so it’s possible to take the pricing equation and solve for volatility given the other variables. The result is implied volatility – a projection of future volatility “voted” on via auction market dynamics in the options market.
Options pricing is actually a very complex, and somewhat controversial topic. It’s way too much to go into in this post. If you’re interested, the Wikipedia page on the Black-Scholes model is a good place to start understanding the issues.
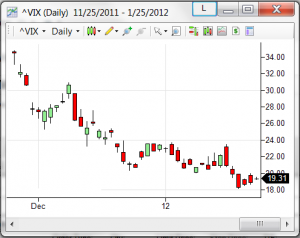
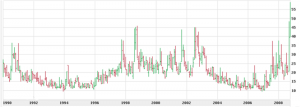
The most common example of implied volatility is the VIX, or volatility index. It’s computed based of S&P 500 options using a variation on the above method. You can see a 1-day chart of it above. Here’s a 1-month cof VIX cribbed from Wikipedia:
As you can see, a low VIX is between 10-15. High values are > 25 or so. Right now, based on the daily chart, we’re in kind of a middle range, moving from a period of high VIX towards lower values. So how do you use this information? Well, it depends on what time frame you’re interested in.
Long Term Trading and Investing
In this context, VIX is sometimes referred to as the “fear index”. Why? Well, as we mentioned the market takes the stairs up and the elevator down. So as you might expect big moves are associated with downward moves, which are associated with fear. Now, the VIX index has only been around a short while (since 1987), but I’d like to make an observation. During that history, there have been three periods of elevated VIX (87-91, 97-03 and 07-present). Between those there have been two periods of relative calm. During those “boring” years the market has radically out-performed the high VIX periods, which included both the .com crash and the housing crisis. Now clearly this is a case of inferring from a very small number of data points, but from an investment perspective it makes sense to me that you might want to overweight stocks during periods of sustained low VIX, and underweight them or avoid them entirely during high VIX. You might do the opposite for risk-off assets like T-bonds – the high VIX periods were very good for them. This could make a nice alternative to age-based asset allocation. Food for thought.
Another, more practical use for VIX numbers is to get some sort of idea what your yearly investing results might look like. Let’s say you buy a S&P ETF (like, say, SPY) and you expect an average 3% annual return from the S&P based on your research. If the VIX is 25, you might reasonably expect 68% of your annual returns will fall between +28% and -22% (one standard deviation/VIX from your projected return). About 95% of your returns would lie between +53% and -47% (2 standard deviations). You could then compare these numbers to your investment goals and risk tolerance, and use that information to decide how big a position you’re willing to take.
Short Term Trading
On short time frames, volatility is the fuel for profits – at least for traders trading flat price. You can’t make money by predicting price changes if the price doesn’t change. Furthermore, the level of volatility determines what sort of trading strategies are effective. High volatility (and the associated big price moves) implies a trending sort of behavior – price moves, and then keeps moving in the same direction. That’s what’s required to create a big move. Low volatility is associated with the opposite – price moves, and then moves back to the original value. As such, trend following systems tend to work best during high volatility and mean reversion systems tend to work best during low volatility.
This creates some difficulties when designing and testing trading systems. A system designed during high volatility may stop working as volatility falls. Ideally system testing will take this into account and develop a profile of what VIX/volatility values a system likes. Even if that’s not possible, it’s important to keep and eye on VIX and realize that things which used to work consistently can stop working when the environment changes. I think as a general principle your stable of trading strategies needs to contain both high-VIX and low-VIX strategies. That way as conditions change you can adapt and don’t just go out of business. Which is a real issue, by the way – during periods of low VIX you see lots of “I quit – this market sucks” posts on trading boards.
Now you know a little something about volatility 🙂

Great overview on volatility and I like that you drove home the point about the differences in historic and implied. More often than not when people look at pricing and see implied volatility levels they think that’s actually where the stock might trade when it probably won’t.